District of Berlin
Tempelhof-Schöneberg
356,959 residents on 53 km², 15 Kieze
Tempelhof-Schöneberg is well served and strong on Culture. Local amenities are above the median at around 46 points. Culture is also above average at about 38 points. Stop density reaches around 11 per square kilometre. Tenant protection is among the strongest in the city at just under 18 points.
The Bezirk is weaker on Green & heat. The score stays below the median at around 51 points. The perceived temperature on hot days is around 37 degrees. Mobility is close to the average at just under 22 points. Overall, the Bezirk ranks 9 of 12.
Kiez score 40 out of 100, rank 9 of 12 districts. The Kiez score combines five areas: quiet and air, green space and heat, mobility, local amenities and tenant protection. Higher is better. For a district, we calculate the same score across the whole district. How the Kiez score is calculated
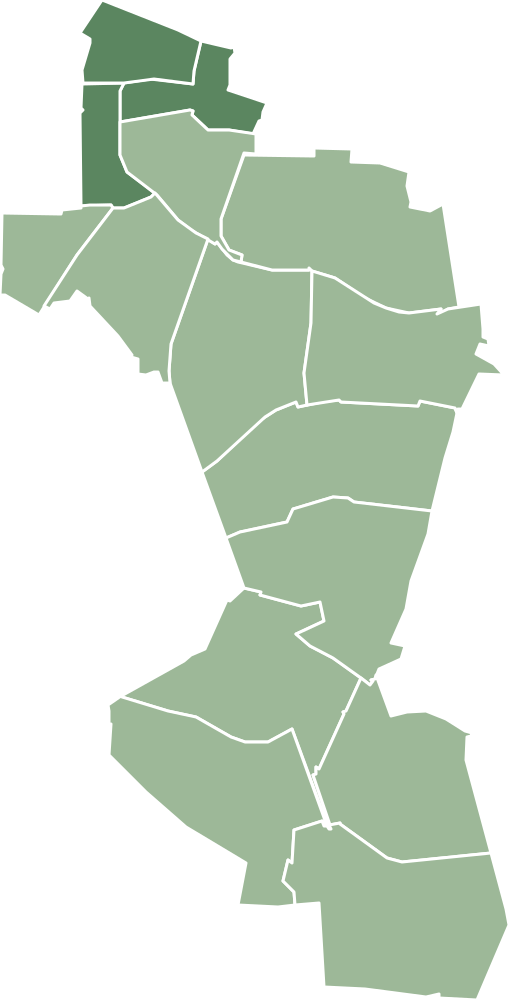
- 0 to 25
- 26 to 50
- 51 to 75
- 76 to 100
- no value
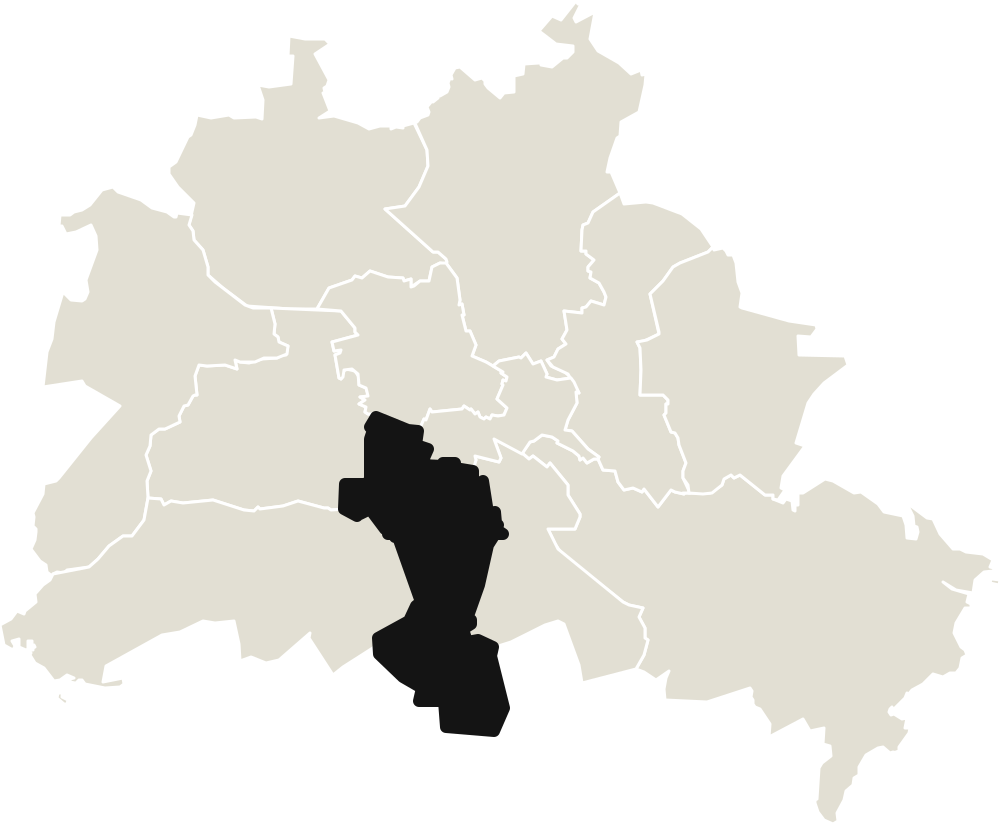
Location of Tempelhof-Schöneberg in Berlin
Noise and air
Traffic noise in Tempelhof-Schöneberg averages 48.6 dB. That is louder than 6 of the 12 districts.
Average noise level over day, evening and night (L_DEN), Strategic Noise Map 2022. Source: Berlin Environmental Atlas.
| Value | Tempelhof-Schöneberg | typical district |
|---|---|---|
| High air pollution, % of sub-areas Sub-areas (planning areas) with high air pollution, Environmental Justice Atlas 2023 | 44 less polluted | 45 |
| Most common noise class, class Most common class of the noise map across the sub-areas | medium | medium |
More values
typical district = median of the 12 districts
- High air pollution, % of sub-areas 44
Sub-areas (planning areas) with high air pollution, Environmental Justice Atlas 2023
typical district: 45 less polluted
- Most common noise class, class medium
Most common class of the noise map across the sub-areas
typical district: medium
| Value | Tempelhof-Schöneberg | Berlin median | Berlin, median |
|---|---|---|---|
| Traffic noise | 48.6 dB | 48.5 dB | 48.5 dB |
| Traffic noise, range of the Kieze in Tempelhof-Schöneberg | 44.6 dB (Lichtenrade Süd) to 52.7 dB (Friedenau Ost) |
Green space and heat
Parks and green spaces cover 9.5% of area in Tempelhof-Schöneberg. That is greener than 8 of the 12 districts.
Public parks and green spaces. Source: Berlin green space register.
| Value | Tempelhof-Schöneberg | typical district |
|---|---|---|
| Little green space near homes, % of sub-areas Sub-areas (planning areas) that the Berlin Senate rates as poorly supplied with green space near homes | 31 worse supplied | 23 |
| Green space provision according to the Senate, class Most common rating of how well people in the sub-areas are supplied with green space near their homes | good | good |
More values
typical district = median of the 12 districts
- Little green space near homes, % of sub-areas 31
Sub-areas (planning areas) that the Berlin Senate rates as poorly supplied with green space near homes
typical district: 23 worse supplied
- Green space provision according to the Senate, class good
Most common rating of how well people in the sub-areas are supplied with green space near their homes
typical district: good
| Value | Tempelhof-Schöneberg | Berlin median | Berlin, median |
|---|---|---|---|
| Parks and green spaces | 9.5% of area | 7.4% of area | 7.4% of area |
| Perceived temperature in the afternoon | 36.6 °C | 35.8 °C | 35.8 °C |
| Parks and green spaces, range of the Kieze in Tempelhof-Schöneberg | 0.4% of area (Lichtenrade Nord) to 49.5% of area (Tempelhof Nord) | ||
| Perceived temperature in the afternoon, range of the Kieze in Tempelhof-Schöneberg | 35.3 °C (Tempelhof Südwest) to 38.5 °C (Lichtenrade Nord) |
Housing and rent
Existing tenants in Tempelhof-Schöneberg pay 7.57 €/m² in net rent. That is more expensive than 6 of the 12 districts.
Net rent in existing rental contracts. Source: Census 2022.
| Value | Tempelhof-Schöneberg | typical district |
|---|---|---|
| Old buildings, % of homes Homes in buildings built before 1949 | 42 | 40 |
| Rent protection areas (Milieuschutz), % of area Area in Milieuschutz zones, where renovations and the conversion of rentals into owned flats need approval | 14 | 4 |
More values
typical district = median of the 12 districts
- Old buildings, % of homes 42
Homes in buildings built before 1949
typical district: 40
- Rent protection areas (Milieuschutz), % of area 14
Area in Milieuschutz zones, where renovations and the conversion of rentals into owned flats need approval
typical district: 4
| Value | Tempelhof-Schöneberg | Berlin median | Berlin, median |
|---|---|---|---|
| Rent in existing contracts | 7.57 €/m² | 7.51 €/m² | 7.51 €/m² |
| Rent in existing contracts, range of the Kieze in Tempelhof-Schöneberg | 6.35 €/m² (Marienfelde Süd) to 8.59 €/m² (Mariendorf Süd) |
Getting around
Tempelhof-Schöneberg has 11.5 stops per square kilometre. That is more than 8 of the 12 districts.
Stops for U-Bahn, S-Bahn, tram and bus. Source: OpenStreetMap.
| Value | Tempelhof-Schöneberg | typical district |
|---|---|---|
| Stop within 400 m, % of residents Residents who live no more than 400 metres from the nearest stop | 97 closer | 96 |
| U-Bahn and S-Bahn stations | 30 | 18 |
More values
The number covers the whole area. Larger areas often have more.
typical district = median of the 12 districts
- Stop within 400 m, % of residents 97
Residents who live no more than 400 metres from the nearest stop
typical district: 96 closer
- U-Bahn and S-Bahn stations 30
typical district: 18
| Value | Tempelhof-Schöneberg | Berlin median | Berlin, median |
|---|---|---|---|
| Public transport stops | 11.5 per km² | 9.3 per km² | 9.3 per km² |
| Public transport stops, range of the Kieze in Tempelhof-Schöneberg | 6.3 per km² (Lichtenrade Nord) to 24.4 per km² (Schöneberg Nordwest) |
Shopping, day care, culture
Tempelhof-Schöneberg has 10.1 food shops per 10,000 residents. That is more than 6 of the 12 districts.
Supermarkets, discounters and other food shops. Source: OpenStreetMap.
| Value | Tempelhof-Schöneberg | typical district |
|---|---|---|
| Pharmacies | 2.0 | 1.6 |
| Day care centres (Kitas) Day care centres | 8.0 | 7.3 |
| Schools | 2.2 | 2.4 |
| Cultural venues Museums, theatres, cinemas, libraries, galleries, clubs and community arts centres | 2.1 | 2.2 |
More values
per 10,000 people
typical district = median of the 12 districts
- Pharmacies 2.0
typical district: 1.6
- Day care centres (Kitas) 8.0
Day care centres
typical district: 7.3
- Schools 2.2
typical district: 2.4
- Cultural venues 2.1
Museums, theatres, cinemas, libraries, galleries, clubs and community arts centres
typical district: 2.2
| Value | Tempelhof-Schöneberg | Berlin median | Berlin, median |
|---|---|---|---|
| Food shops | 10.1 per 10,000 people | 9.0 per 10,000 people | 9.0 per 10,000 people |
| Food shops, range of the Kieze in Tempelhof-Schöneberg | 4.9 per 10,000 people (Marienfelde Süd) to 20.5 per 10,000 people (Schöneberg Südost) |
People
Tempelhof-Schöneberg has 6,729 residents per square kilometre. That is more than 8 of the 12 districts.
Registered residents, as of the end of 2024. Source: Statistical Office Berlin-Brandenburg.
| Value | Tempelhof-Schöneberg | typical district |
|---|---|---|
| Recorded crime, index, weighted cases per 100,000 people Frequency rate per planning region (Bezirksregion), not per address. The value relates recorded cases to registered residents and does not measure personal risk. Places with many tourists or commuters look worse as a result, and unreported crime is missing. The value is not a safety ranking. | 960 | 891 |
| Social situation, class Most common level of the sub-areas in the Senate's Social Urban Development Monitoring 2025 | medium | medium |
More values
typical district = median of the 12 districts
- Recorded crime, index, weighted cases per 100,000 people 960
Frequency rate per planning region (Bezirksregion), not per address.
What does the value mean?
The value relates recorded cases to registered residents and does not measure personal risk. Places with many tourists or commuters look worse as a result, and unreported crime is missing. The value is not a safety ranking.
typical district: 891
- Social situation, class medium
Most common level of the sub-areas in the Senate's Social Urban Development Monitoring 2025
typical district: medium
| Value | Tempelhof-Schöneberg | Berlin median | Berlin, median |
|---|---|---|---|
| Population density | 6,729 people per km² | 5,034 people per km² | 5,034 people per km² |
| Population density, range of the Kieze in Tempelhof-Schöneberg | 3,004 people per km² (Marienfelde Süd) to 18,465 people per km² (Schöneberg Südwest) |
Elections since 2011
In the 2026 Abgeordnetenhaus election, Die Linke came first in Tempelhof-Schöneberg with 23%. In all of Berlin it also came first, with 26%. Since 2011 Die Linke has gained 19 percentage points here, and the SPD has lost 13.
Each small chart shows one party, all on the same scale. For the districts the data go back to 2011 (Abgeordnetenhaus) and 2013 (Bundestag).
| Party | 2011 | 2016 | 2021 | 2023 | 2026 |
|---|---|---|---|---|---|
| CDU | 29% (23%) | 20% (18%) | 21% (18%) | 31% (28%) | 21% (19%) |
| Die Linke | 4% (12%) | 10% (16%) | 10% (14%) | 9% (12%) | 23% (26%) |
| FDP | 2% (2%) | 8% (7%) | 7% (7%) | 5% (5%) | – |
| GRÜNE | 23% (18%) | 19% (15%) | 22% (19%) | 22% (18%) | 18% (14%) |
| PIRATEN | 8% (9%) | 2% (2%) | 0% (0%) | 0% (0%) | – |
| SPD | 27% (28%) | 25% (22%) | 23% (21%) | 20% (18%) | 14% (12%) |
| Sonstige | 5% (7%) | 4% (6%) | 9% (9%) | 5% (6%) | – |
| AfD | – | 11% (14%) | 6% (8%) | 6% (9%) | 12% (16%) |
| BSW | – | – | – | – | 4% (5%) |
Neighbouring districts and Kieze
“Compare” sets every chapter on this page against the chosen district. The name opens its own page.
Borders
Districts that share a border
The 15 Kieze in Tempelhof-Schöneberg
The Kiez score at a glance
Tempelhof-Schöneberg scores 40 out of 100 points and ranks 9 of 12 districts. Each row shows one area, more points are better. The ring is the Berlin median.
Culture and recorded crime do not count towards the Kiez score. Crime is therefore shown separately and without a rating.
| Area | Tempelhof-Schöneberg | Berlin median | Difference |
|---|---|---|---|
| Overall score | 40 | 40 | −1 |
| Quiet & air | 64 | 68 | −4 |
| Green & heat | 51 | 60 | −10 |
| Mobility | 22 | 22 | ±0 |
| Local amenities | 46 | 42 | +4 |
| Tenant protection | 18 | 9 | +9 |
| Culture | 38 | 28 | +9 |
| Recorded crime | 37 | 35 | +2 |
Frequently asked questions
›How loud is it in the Tempelhof-Schöneberg district?
Moderately loud. 55 percent of the subareas are in the noise class medium, 23 percent in the class high and 21 percent in the class low. This means traffic noise from roads, rail and aircraft, averaged over day, evening and night. The navigator.berlin Quiet & air score combines noise and air. There the district gets 64 of 100 points, rank 9 of 12 districts. That is less than the median Berlin district. Source: Noise pollution 2023, as of January 2024.
›How up to date is the noise data for Tempelhof-Schöneberg?
The noise classes date from January 2024. The Senate has the noise map recalculated every five years, in line with the EU cycle.
›How well is the Tempelhof-Schöneberg district supplied with green space?
Mixed, according to the Senate. 34 percent of the subareas are rated as well served with green space, 34 percent as moderately served and 32 percent as poorly served. The Senate measures how much public green space per person lies near homes. The navigator.berlin Green & heat score is a different measure. It combines green space and heat. There the district gets 51 of 100 points, in the bottom quarter of the 12 districts. That is less than the median Berlin district. Source: Green space provision 2023, as of January 2024.
›How many public green spaces are there in the Tempelhof-Schöneberg district?
The Senate counts 144 public green spaces in the district. Private gardens and allotments are not included. Source: Green spaces, as of April 2026.
›How well is the Tempelhof-Schöneberg district served by bus and train?
The stop network here is moderately dense, in the Berlin mid-range. There are 11.4 stops per square kilometre. The district has 19 U-Bahn stations, 11 S-Bahn stations and 575 bus stops, but no tram stop. In the navigator.berlin Mobility score, the district gets 22 of 100 points, joint rank 7 of 12 districts. That is about the same as the median Berlin district. Source: Public transport stops (BVG + S-Bahn), as of May 2026.
›Where does the Tempelhof-Schöneberg district stand in the Senate social monitoring?
The status index is in the medium range of the Berlin distribution. The Monitoring Social Urban Development sorts every planning area into one of four levels by income, employment and education. The level applies to whole areas, not to individual households. Source: Social status index (MSS 2025), as of December 2024.
›Does navigator.berlin rate residential areas as good or bad?
No. We show ratings from official data, such as the Mietspiegel residential area type, the social monitoring or the standard land value. These ratings describe a place; they do not judge it. We do not use labels such as “popular Kiez” or “good district”.
›How much tenant protection is there in Tempelhof-Schöneberg?
In the navigator.berlin Tenant protection score, the district gets 18 of 100 points, rank 3 of 12 districts. That is more than the median Berlin district. The score measures how much of the area is under Milieuschutz. Milieuschutz is meant to protect tenants from displacement.
›How hot does the Tempelhof-Schöneberg district get in summer?
On hot days it gets warm here, but not extreme: the perceived temperature averages 36.6 degrees. The perceived temperature (PET) takes sun, wind and humidity into account. Source: Perceived temperature 2022, as of June 2024.